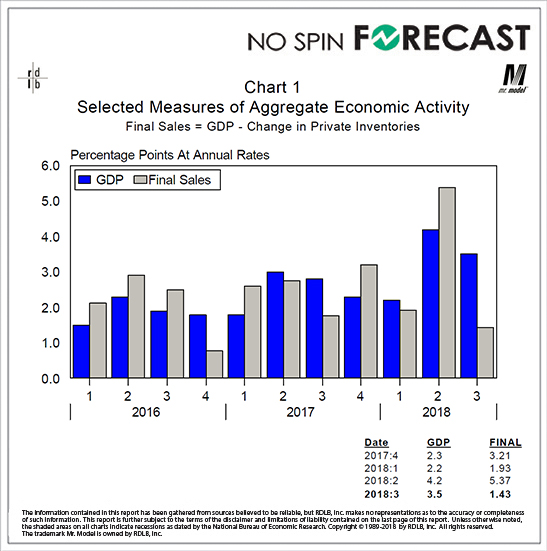
The latest GDP report showed that the pace of growth has slowed between the second and the third quarters of the year. Was this good or bad news?
The reason why this is being asked is because of the divergence of the bars on the right side of the chart. Why did this happen, and what does it mean?
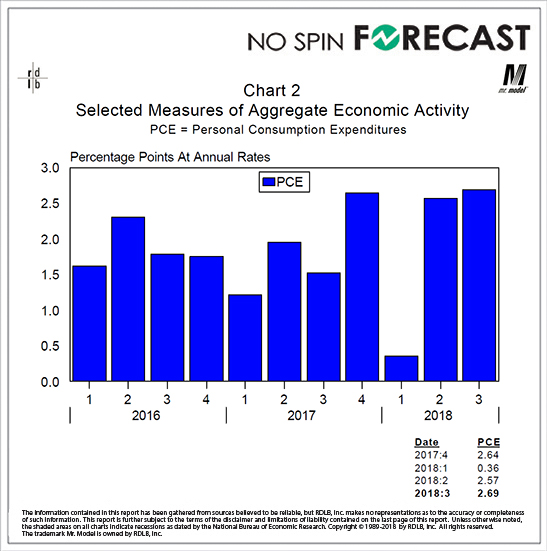
Consumers Continue to Do Their Part
This is the reason why the blue bar on the other chart is as big as it is. But, this is what is supposed to be happening. Consumers got a tax cut and the unemployment rate is low. So, we expect them to be out there buying goods and services.
The last two bars on the right side of the chart are virtually identical. Like they are supposed to be.
The folks who are celebrating this as something special remind me of the football players who celebrate first downs. Dude, go back to the huddle.