Chart 1: Selected Measures of Aggregate Economic Activity
The Bureau of Economic Analysis (BEA) published its first estimate of second quarter Gross Domestic Product (GDP) this morning along with revisions to the series that go back to 2013.
The headline number of a 1.2% seasonally adjusted annual rate of growth, was well below the consensus estimates of a number almost twice as large. There were several reasons why the number undershot the expected value, principal among which was another large negative contribution from business inventories. This was the fifth consecutive quarter in which inventories have made a negative contribution to GDP. It was also the largest such contribution.
As you can see from the chart, the pattern of the revisions was mixed, with some quarters being revised up and others down. That is about par for the course in these events. The profile of both series over the past five quarters was unchanged.
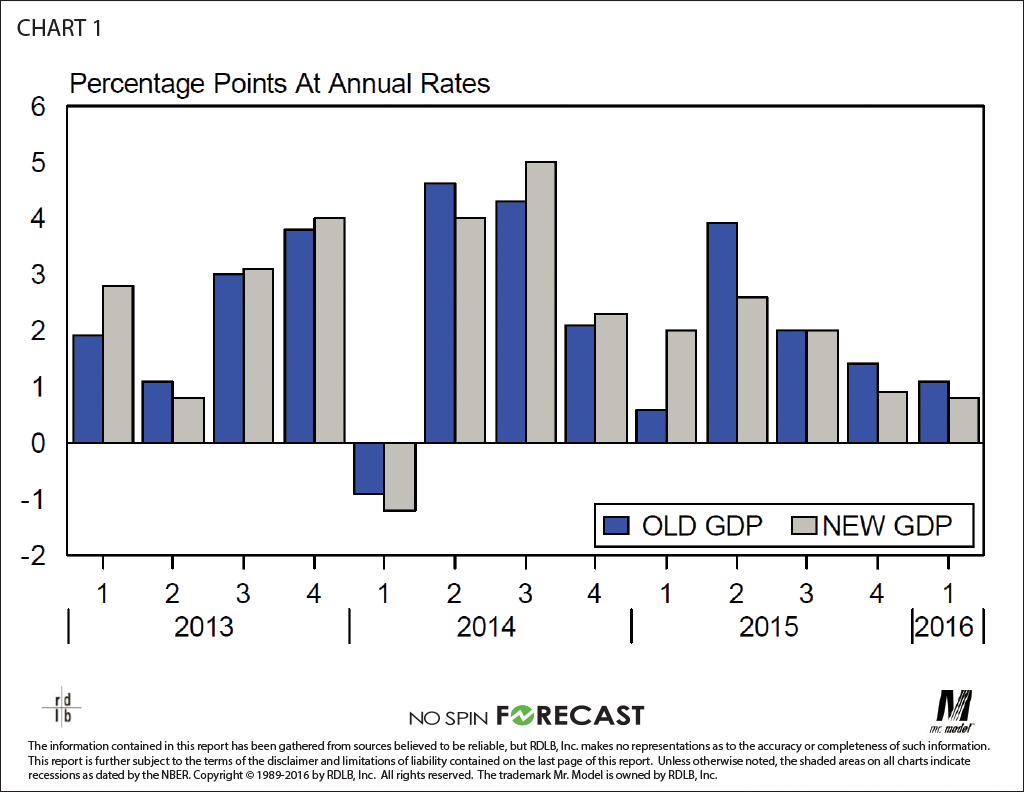
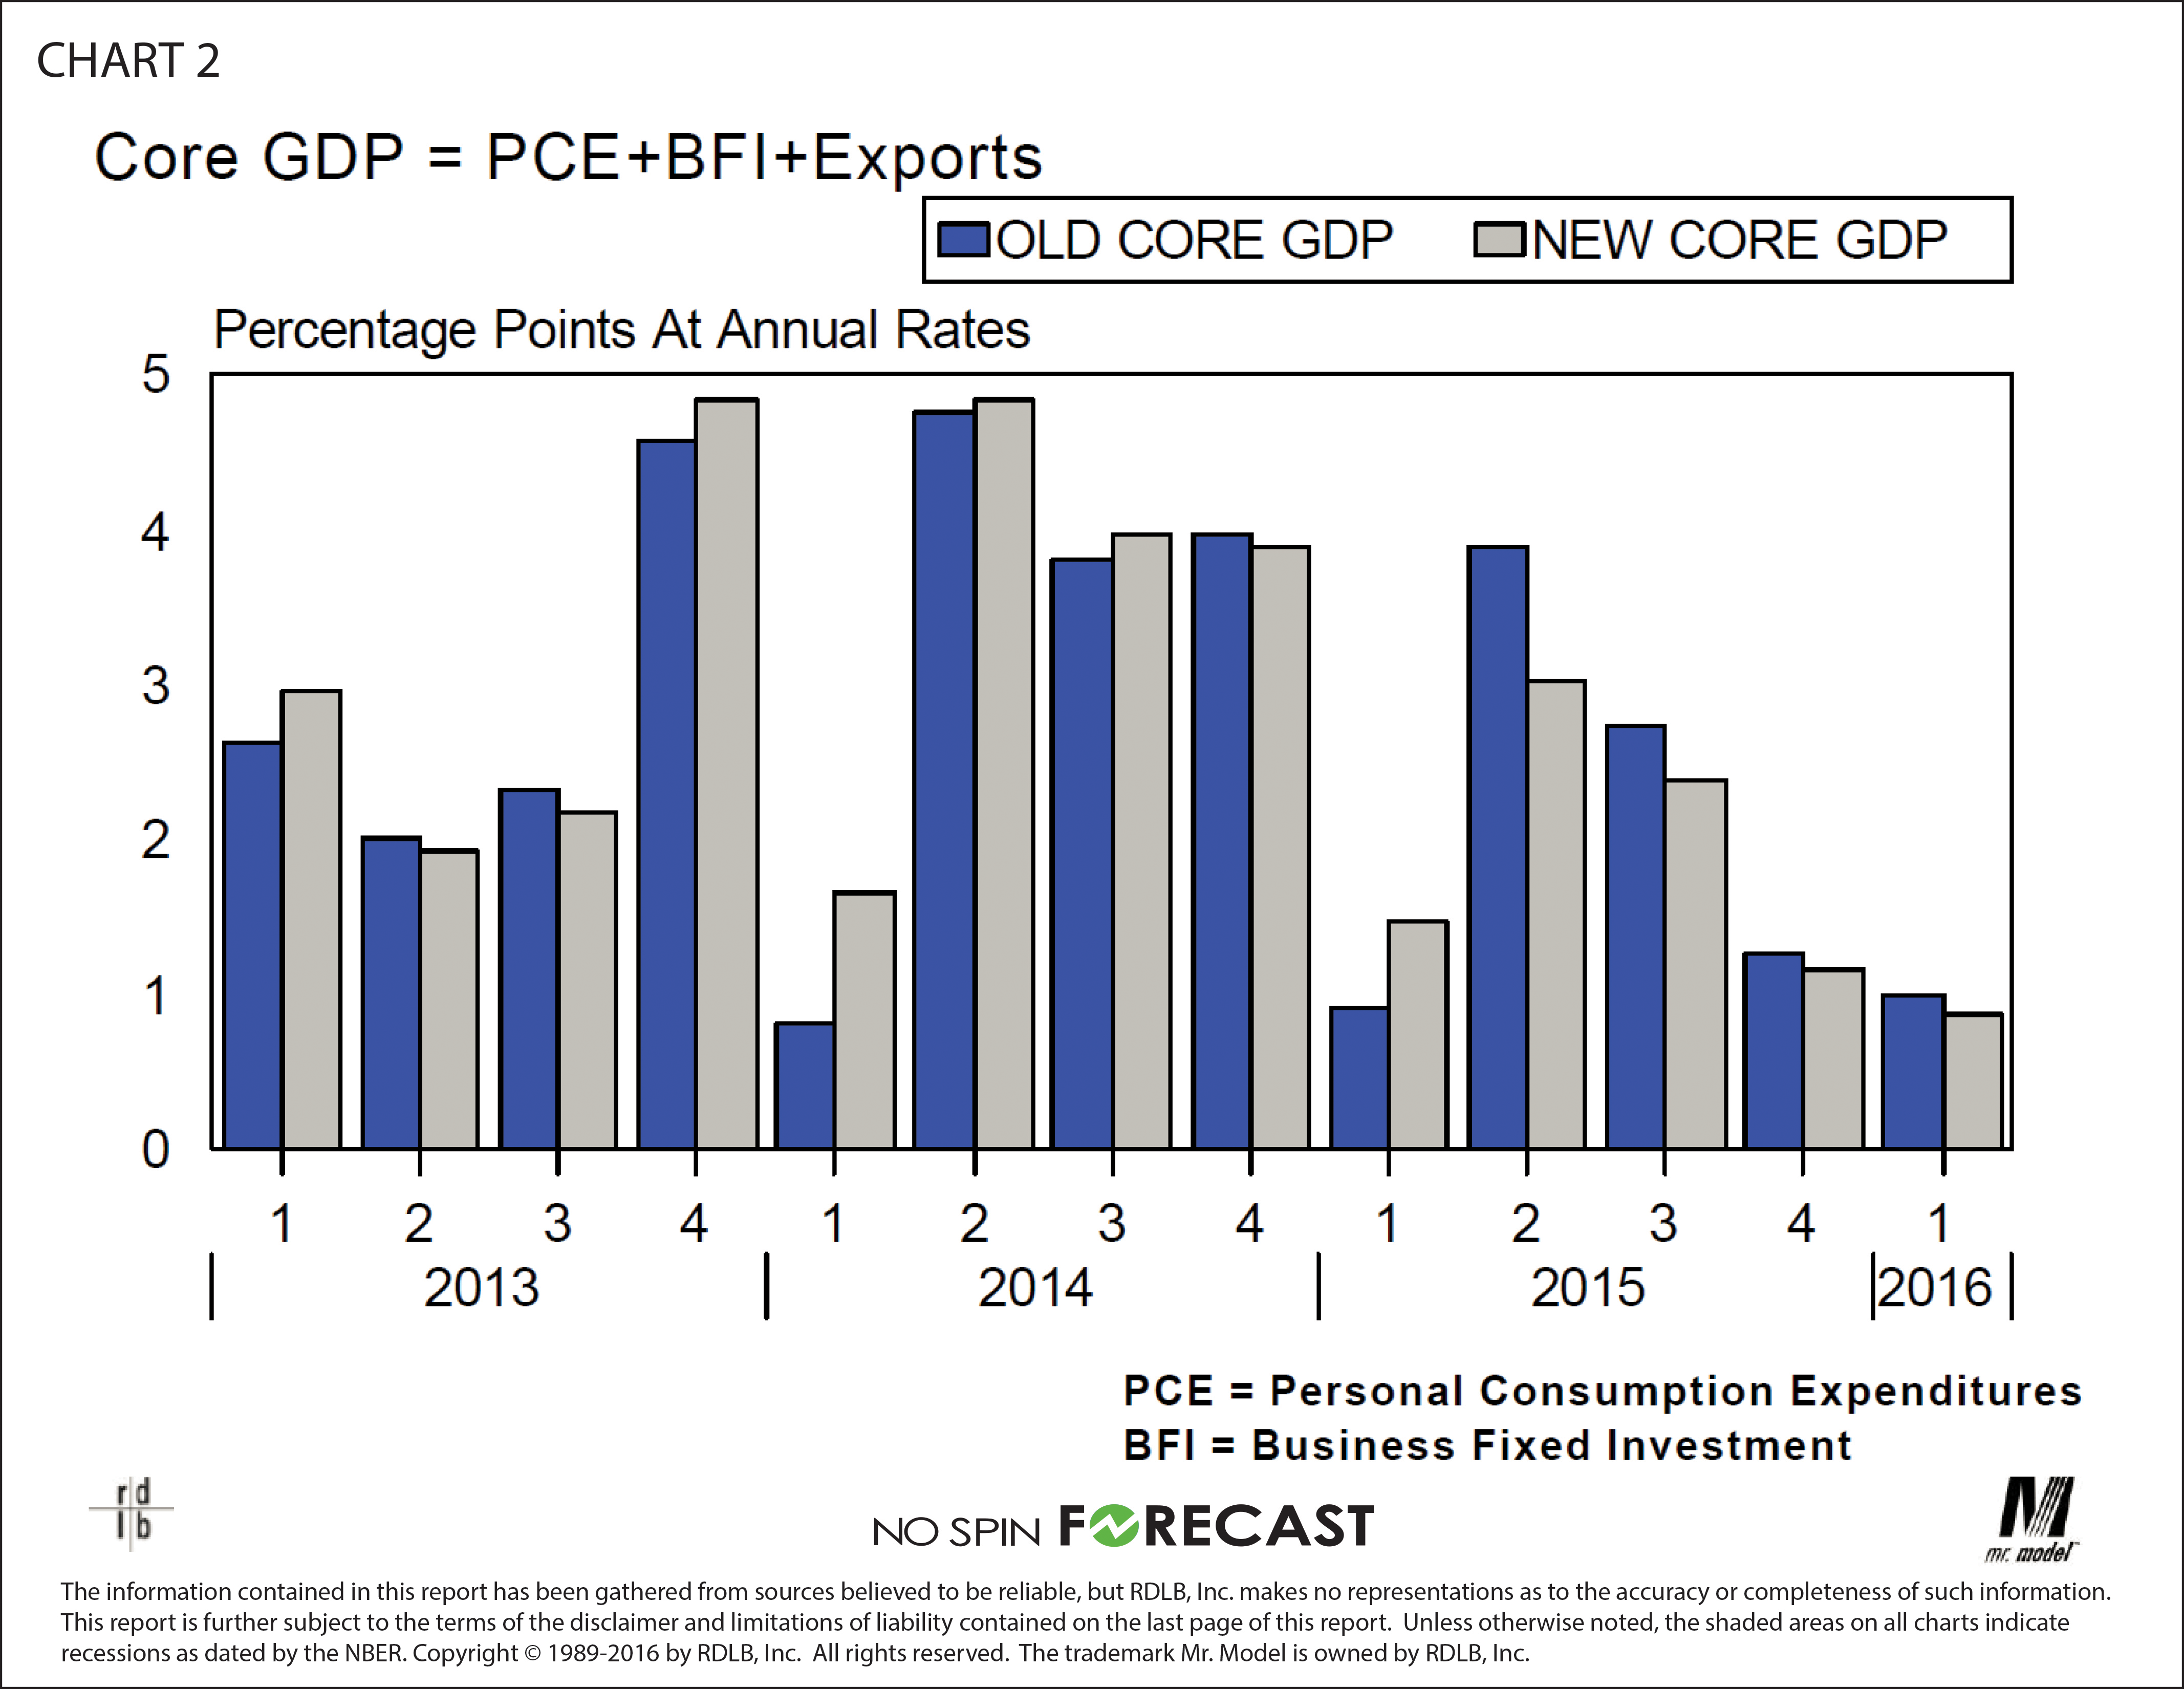
Chart 2: Selected Measures of Aggregate Economic Activity
The revisions to Core GDP were in line with those made to headline GDP. This is not always the case, by the way. There have been times when the revisions have hit some sectors harder than others. This time, as we shall see in a moment, they were spread fairly evenly across the components.
As was the case with the headline number, the profile of this series over the last four quarters was little changed.
Read the full special report. Click here >>