The BLS asks every survey respondent (they survey 60,000 households every month) whether they are working full-time or part-time. Those who answer part-time are then asked whether they are working part-time because they have to or because they want to. Those who answer that they “have to” are included in the count we saw on Chart 28. Those who answer that they “want to” are counted here.
You might ask, who wants to work only part-time. The answer is all those who cannot hold a full-time job because of other commitments (such as school or family needs) or a preference for part-time work (Social Security beneficiaries who want to stay below the taxable threshold for benefits, seasonal workers).
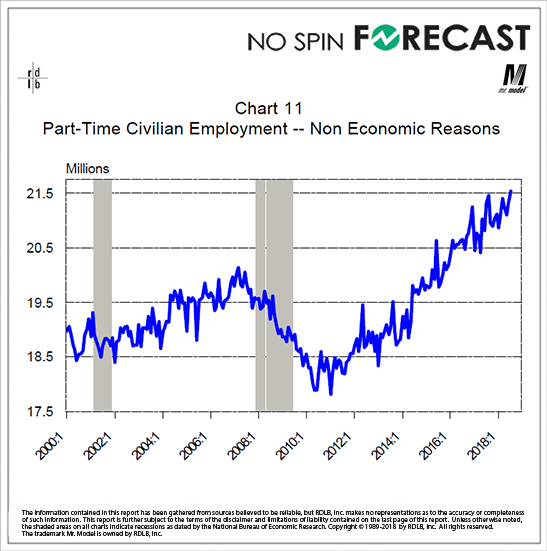
As you see here this pattern of employment follows the cyclical pattern we associate with overall employment: rising in expansions and falling in recessions. Seasonal patterns account for most of the big changes you see.