The monthly employment report is actually two employment reports. One covers payroll employment, the other household employment. The Unemployment Rate comes out of the household survey. Interpreting changes in that number requires careful examination.
The Bureau of Labor Statistics (BLS) recently told us that the Unemployment Rate fell to 8.1% in August from 8.3% in July. One would think this was good news. But, it turns out it was not. In order to understand why it wasn’t we have to explain how changes in the Unemployment Rate come about.
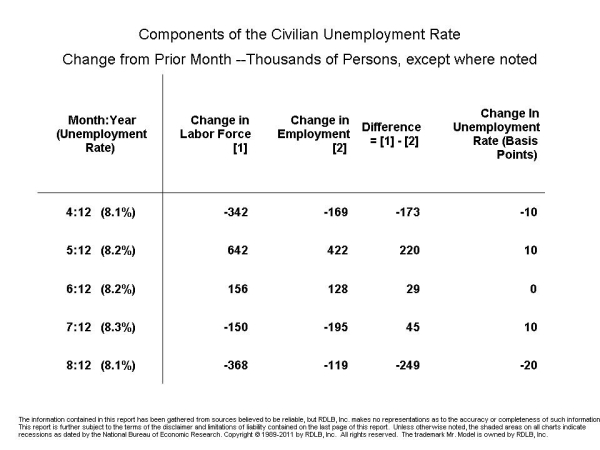
Let’s start with the basics. The Unemployment Rate is the ratio of the number of persons who are unemployed to the number of persons in the Civilian Labor Force. How do we know who those people are? Well, every month the Bureau of Labor Statistics conducts a survey, called the household survey, where they go out and interview about 60,000 eligible households and ask them a battery of questions about their employment status. From the answers, the BLS compiles its estimates of the number of people who are in the labor force, employed, and unemployed. The estimates are then put through a program that adjusts for seasonal variations in the three categories. And it is those figures that form the basis for the calculations we make in the following table.
 Let me walk you through the entries, since the table can be hard to digest the first time you see it. Starting on the left we have the date of the report and the level of the Unemployment Rate. In the next column we see the change in the number of people in the labor force. In August (8:12) we see that 368,000 people left the labor force. Next, we have the change in the number of people who were employed. This was a drop of 119,000. Then we have the change in the number of people who were unemployed, down 249,000. Finally, we have the change in the Unemployment Rate. Minus 20 Basis points or -0.2%. (There are 100 Basis Points in a percentage point, and it is usually easier to talk about changes in percentages in Basis Points. Trust me it is and you will get used to it.)
Now, how can it be that the Unemployment Rate is going down and people are not getting hired? Furthermore, if people are not getting hired, how is it possible for the number of unemployed to be going down? Where are we, in Bizzaroland?
Well, let’s take a hypothetical place where we have 10 people in the work force and 9 people working and one person who is unemployed. The unemployment rate is 10%. (1 divided by 10). Now, let’s say that the unemployed person decides to move away. When we next survey the situation we find that the labor force is 9 people and 9 people are working. So the unemployment rate is zero! How many people got jobs? Zero. What do we conclude from this? That the change in the unemployment rate does not tell you all you need to know about labor market conditions.
The decline in the Unemployment Rate we saw in August was not, as some tried to portray it, an indication of improving labor market conditions. It was roughly analogous to what we described in our example: there were fewer unemployed because many of those who had been unemployed left the work force
So, what will you need to know the next time you see a change in the unemployment rate? First, was the labor force up or down? Second, was the level of employment up or down? The simple rule is that a strong employment report is one that will show the labor force rising and the number of people employed rising by more than the increase in the labor force. When those things happen the Unemployment Rate tends to fall. None of those conditions were met in August, so that’s how we knew we had a weak number on our hands.