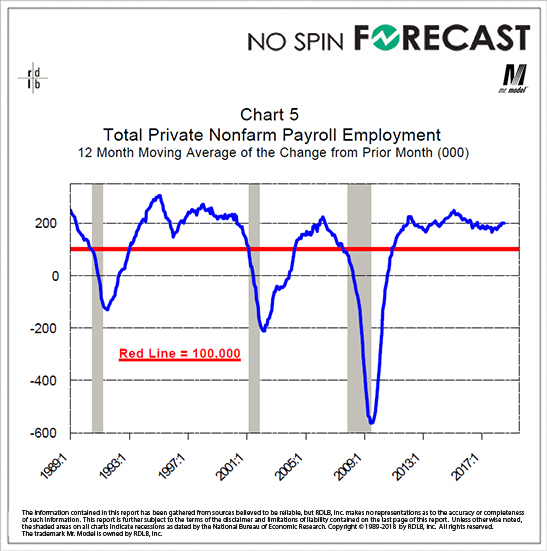
This is my second-most favorite way to present the data. We eliminate the noise by using a 12-month moving average. With the series smoothed out we can then add some other aspects to the chart that help us with the claim about this being the readings we get during the expansion.
As you see here, there are no recessions when this line is north of 100,000. But, we know that there are more phases to the cycle than just Expansion and Recession. So, what can we do to improve our ability to identify cycle phases?