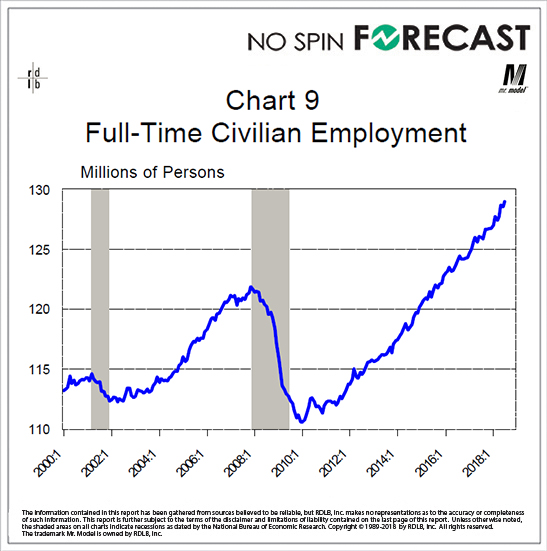
The same way as I had to open the scale on nonfarm payrolls, I had to open the scale on this chart. For those of you new to the report, total civilian employment breaks down into full-time and part-time employment. And those partitions are what we are next going to explore.
While you might have to scroll back a few charts to see, this line does not describe the smooth path higher and lower that total nonfarms traced out on Chart 21. True, there are some wrinkles in that line, but nothing like the moves you see on this one.
When I mentioned that the report gets a letter grade and there were a few other criterion that would determine whether the preliminary grade we put in place earlier would hold, this is one of the places we check.
In order for the A grade to hold we need to see a gain in full-time employment. And we did. So, no markdown here.