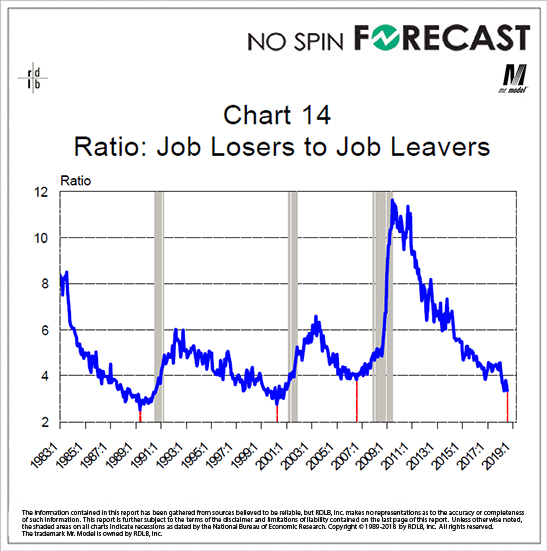
By the thinnest of margins, this series just set a new low for this expansion. And, I also added a column to the table that shows the interval from the last three cycle lows to the next cycle peak, with the date of that cycle peak.
Based on the numbers in the table, this chart says the next business cycle peak would happen some time between July of 2019 (11 months) and December of 2019 (16 months). Of course, all of that changes if this series sets another cycle low.
We hasten to add, that the loser leaver ratio is a third level indicator in the forecasting process. The first level is made up of the EAS and its three coincident indicators. The second level is an array of employment and output indicators that I follow. The third is several ratios, many of which appear in this report, that help to provide more nuance and context.