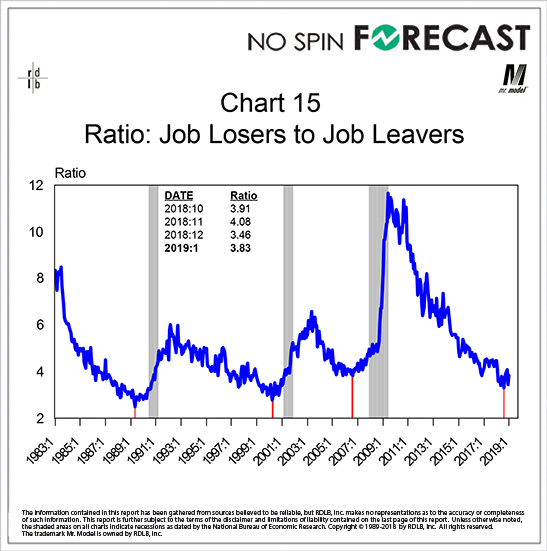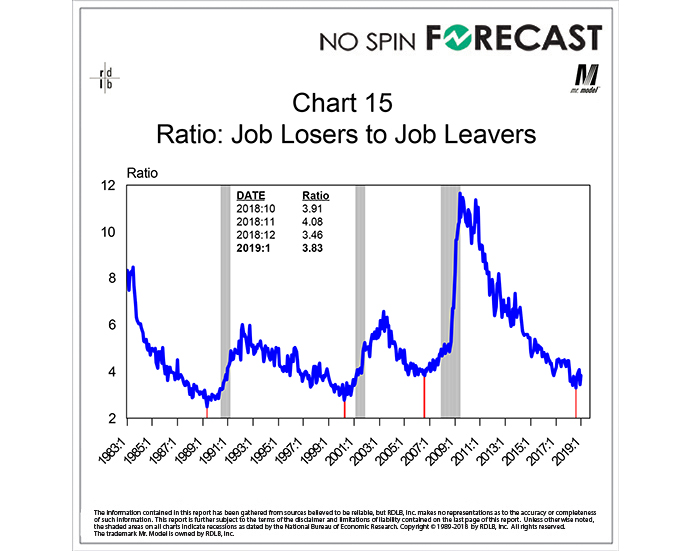
This statistic compares the number of people who lose their jobs in a given month to those who leave their jobs during that same month. The ratio goes down over the course of the expansion both because fewer lose their jobs as employment conditions improve and because more people voluntarily leave their jobs as employment conditions improve.
This statistic makes its bottom before the end of the expansion. And watching it do that is an important piece of information about when one might expect the business cycle peak to occur. The red line on the right side of the chart marks the current cycle low that was set last August.