One of the most important pieces of economic information to appear each month is the level of Nonfarm Payroll employment. It is also one of the most misunderstood and misinterpreted statistics out there.
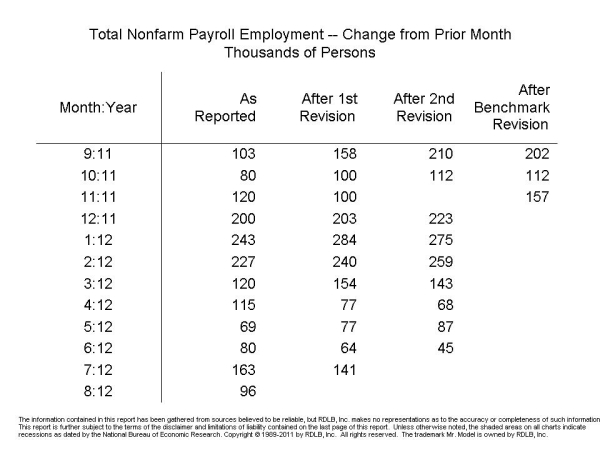
On Friday September 7, the Bureau of Labor Statistics released the nonfarm payroll (NFP) figures for August. The report showed a gain of 96,000 persons. That news was greeted with groans, as expectations had the number north of 150,000 persons. Was the report as weak as it appeared? Actually, it was weaker. And had the folks writing the stories at the various news outlets been in possession of the table you are about to look at they would have known. Why? Because when it comes to the employment number, very rarely is what you see what you get.
 Although you might think otherwise, very few of the people who write the story on nonfarm payrolls seem to be aware of the fact that the number gets revised several times before it becomes final. That’s the reason there are four columns on the table.
The first two revisions are made in the two months immediately following each release date. The benchmark revision is made once a year and published with the data for January each year. That’s why November does not have an entry in the 2nd revision column. But, the benchmark revisions cover the prior three years. So, as it turns out, the number of persons on nonfarm payrolls in August 2012 won’t really be known until 2015.
But, back to what we learned in the latest release. Turns out the revisions to June and July were both to the downside. 19,000 in June and 22,000 in July. When you net out those changes, we find that the August advance was only 55,000 people, and not the 96,000 of the headline (96,000-19,000-22,000 = 55,000). Now, that’s a weak number.
The lesson here is that you must look beyond the headline to figure out what really happens every month with NFPs. The Bureau of Labor Statistics publishes the revisions as part of the commentary they include at the front of the report. So, if you look at their press release you can get the figures. Or, you can read the Employment Situation Report, which always starts with the table above and then goes into more detail on what the numbers mean.